Housing Report

2018 Watertown Year in Review

Want to know how the Watertown, Massachusetts real estate market is doing? In this 2018 Year in Review Housing Report, we’re looking at home sales in Watertown for 2018 compared to 2017 and how the market is currently performing in that area. As of December 31, 2018, a total of 411 homes sold in Watertown at an average

2018 Watertown Year in Review Read More »

2018 Southern New Hampshire Year in Review

Sales down 5.6% and prices up 4.3% The Southern New Hampshire housing market experienced a similar outcome as Massachusetts in that sales declined, and prices increased when compared to 2017.  Low inventory influenced the effect that lack of supply has on demand and raised prices. For this report, we are examining the three counties that make up

2018 Southern New Hampshire Year in Review Read More »

December 2018 Housing Report

The Lamacchia Housing Report presents overall home sale statistics and highlights the average sale prices for single families, condominiums, and multi-family homes in Massachusetts and Southern New Hampshire for December 2018 compared to December 2017. It also looks at other metrics in Massachusetts like Homes Listed for Sale, Homes Pending, and Price Adjustments made to

December 2018 Housing Report Read More »

November 2018 Housing Report

The Lamacchia Housing Report presents overall home sale statistics and highlights the average sale prices for single families, condominiums, and multi-family homes in Massachusetts and Southern New Hampshire for November 2018 compared to November 2017. It also looks at other metrics in Massachusetts like Homes Listed For Sale, Homes Pending, and Price Adjustments made to

November 2018 Housing Report Read More »

October 2018 Housing Report

The Lamacchia Housing Report presents overall home sale statistics and highlights the average sale prices for single families, condominiums, and multi-family homes in Massachusetts and Southern New Hampshire for October 2018 compared to October 2017. It also looks at other metrics in Massachusetts like Homes Listed For Sale, Homes Pending, and Price Adjustments made to

October 2018 Housing Report Read More »

September 2018 Housing Report

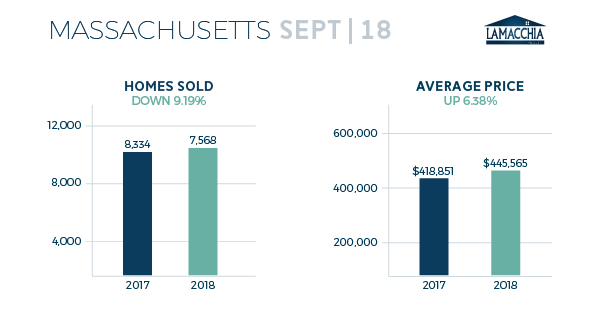
It’s Clear the Market HAS Changed The Lamacchia Housing Report presents overall home sale statistics and highlights the average sale prices for single families, condominiums, and multi-family homes in Massachusetts and Southern New Hampshire for September 2018 compared to September 2017. It also looks at other metrics in Massachusetts like Homes Listed For Sale and

September 2018 Housing Report Read More »

July 2018 Housing Report

Home Sales Are Up but Will it Continue!? The Lamacchia Housing Report presents overall home sale statistics and highlights the average sale prices for single families, condominiums, and multi-family homes in Massachusetts and Southern New Hampshire for July 2018 compared to July 2017. It also looks at other metrics in Massachusetts like Homes Listed For

July 2018 Housing Report Read More »

2018 Mid-Year Housing Report

Click to Enlarge This Lamacchia Mid-Year Housing Report presents overall home sale statistics as of the first six months of 2018 compared to the same period last year, January 1st to June 30th, 2017. Highlighted in this report are the average sale prices for single-family, condominiums, and multi-family homes in Massachusetts and New Hampshire. This

2018 Mid-Year Housing Report Read More »